Global Beverage Volume Comparator
Hover over bars to see details. Data represents estimated global volumes in billion hectoliters (2021).
By Tracked Commercial Category
Winner: Tea
With 4.8 billion hectoliters consumed globally, tea surpasses packaged water, milk, coffee, and soft drinks in measured sales volume.
By Total Human Intake
Winner: Plain Water
When including unmeasured tap water, plain water is the most popular non-alcoholic drink, constituting over 50% of daily beverage intake in major markets.
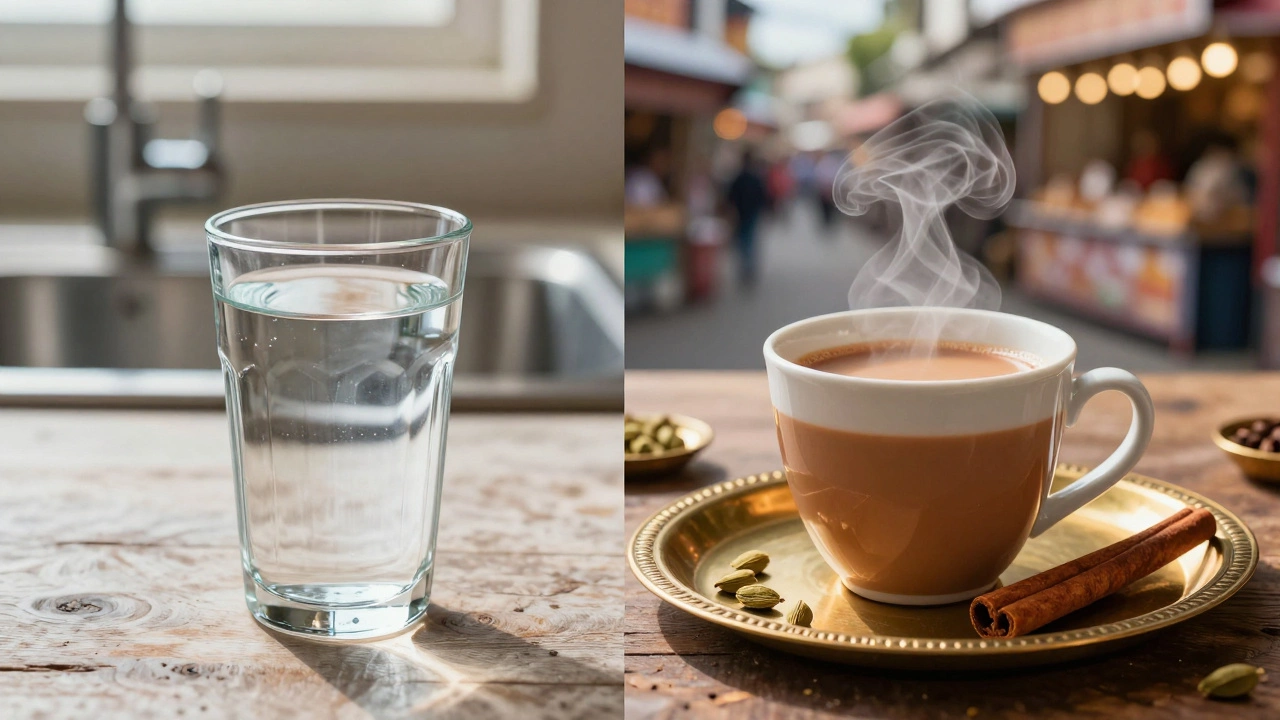
You might think cola or coffee wins the global popularity contest. After all, you see those brands everywhere. But when we look at the actual numbers of liquid consumed by humans across the planet, the answer is surprisingly simple. It’s either plain water or tea. Which one takes the crown depends entirely on how you count.
If you count every drop a person drinks from a tap, a bottle, or a glass, water is the undisputed king. However, if you look at specific beverage categories tracked by market researchers-excluding unmeasured tap water-Tea is the most popular defined non-alcoholic beverage category in the world by volume. This distinction matters because it changes how we understand drinking habits globally.
The Case for Water: The Default Choice
Let’s start with the obvious. Humans need water to survive. It makes sense that it would be the most consumed liquid. In the United States, public health data paints a clear picture. The Centers for Disease Control and Prevention (CDC) analyzed dietary recalls from 2015 to 2018 and found that water accounted for 51.2% of total non-alcoholic beverage consumption among adults on any given day. That is more than half of everything people drank that wasn’t alcohol.
Coffee came in second at 14.9%, followed by sweetened beverages at 10.2% and tea at just 8.7%. When you include all sources of water-tap, bottled, and fountain-water dominates the landscape. In markets like the U.S., bottled water alone has been the number-one packaged beverage by volume for nine consecutive years leading up to 2024. People there drank 16.4 billion gallons of bottled water in 2024 alone.
However, global tracking of water is tricky. Market research firms don’t easily measure how much tap water someone drinks at home in rural India or urban China. Because this "unrecorded" water isn’t always captured in commercial sales data, water often disappears from the top spot in global industry reports, even though it remains the biological default for billions of people.
Why Tea Wins the Commercial Category Title
When industry analysts strip away unmeasured tap water and look at sold products, tea steps into the lead. According to the Beverage Marketing Corporation’s "Global Multiple Beverage Marketplace 2023" report, tea reached approximately 4.8 billion hectoliters in global volume consumed in 2021. To put that in perspective, that represented about 8.4% of all liquid consumed by humans worldwide that year.
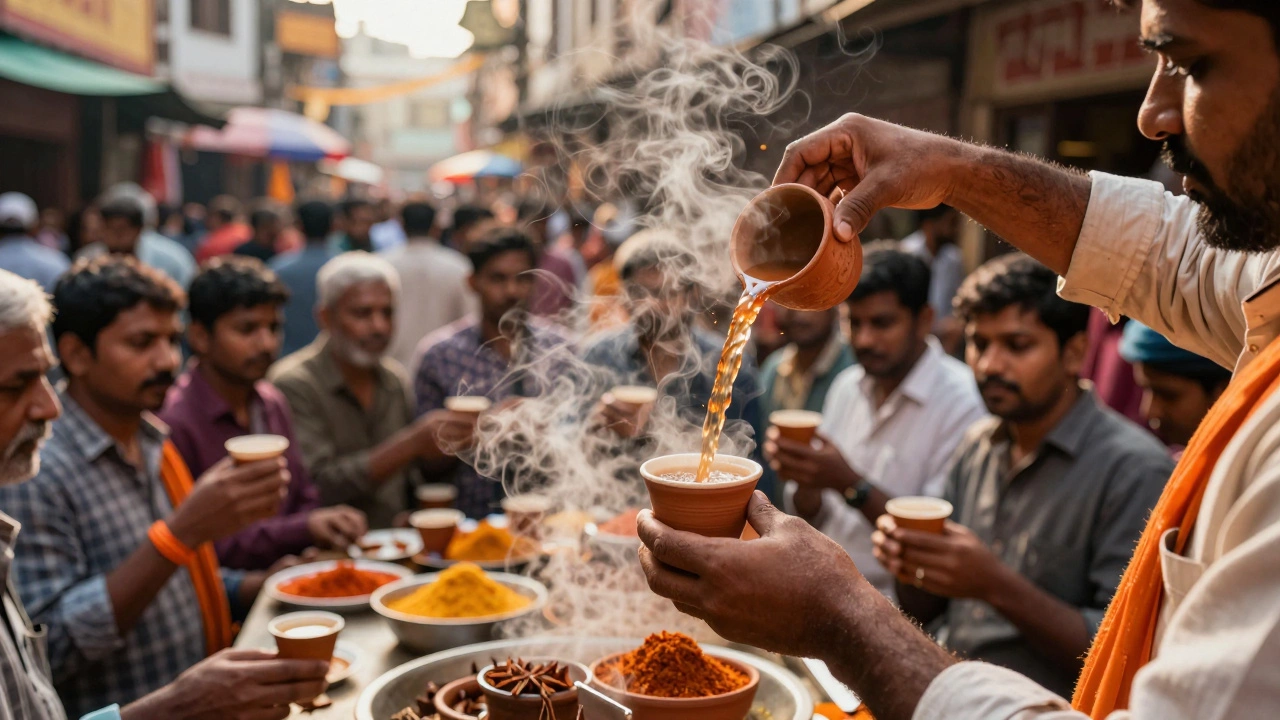
In this specific ranking of tracked beverage categories, tea beat out packaged water, milk, soft drinks, and coffee. Why does tea hold such a massive share? It comes down to population density and culture. Tea has deep historical roots in the world’s two most populous countries: China and India. If you add Indonesia and Japan to the mix, tea is the preferred "core consumption beverage" in four of the ten most populous nations on Earth.
A widely cited statistic suggests that for every cup of coffee consumed globally, around three cups of tea are drunk. While exact global cup counts are hard to verify, the volume data supports the idea that tea outsells coffee, soft drinks, and alcohol combined when looking at total category volume.
| Beverage Category | Global Volume (Hectoliters) | Share of Total Liquid Intake | Primary Markets |
|---|---|---|---|
| Tea | 4.8 Billion | 8.4% | China, India, UK, Russia |
| Packaged Water | ~3.5 Billion* | ~6.5%* | USA, Europe, Urban Asia |
| Milk | ~3.2 Billion* | ~5.8%* | Europe, North America, Australia |
| Coffee | ~2.5 Billion* | ~4.5%* | Nordic Countries, USA, Brazil |
| Soft Drinks | ~2.0 Billion* | ~3.6%* | USA, Mexico, Latin America |
The Regional Divide: Coffee and Soft Drinks
While tea leads globally, it doesn’t win everywhere. Local preferences create strong regional champions. In the Nordic region-specifically Norway, Sweden, Denmark, Finland, and Iceland-coffee is the dominant core beverage. These countries consume more coffee per capita than almost anywhere else on the planet.
Similarly, carbonated soft drinks hold a powerful grip in the Americas. In the United States and Mexico, soft drinks are often the preferred "core consumption beverage" over tea. Brands like Coca-Cola have achieved near-universal recognition, making them the most popular *branded* non-alcoholic drink in many Western households, even if their total volume trails behind generic tea and water.
This highlights a key difference between "popularity" as volume versus "popularity" as brand awareness. You might not drink Coke every day, but you know the brand. You likely drink water daily, but you rarely think of it as a brand unless it’s Evian or Dasani. Tea sits in the middle: it’s a high-volume category with both generic loose-leaf consumption and growing branded ready-to-drink (RTD) options.
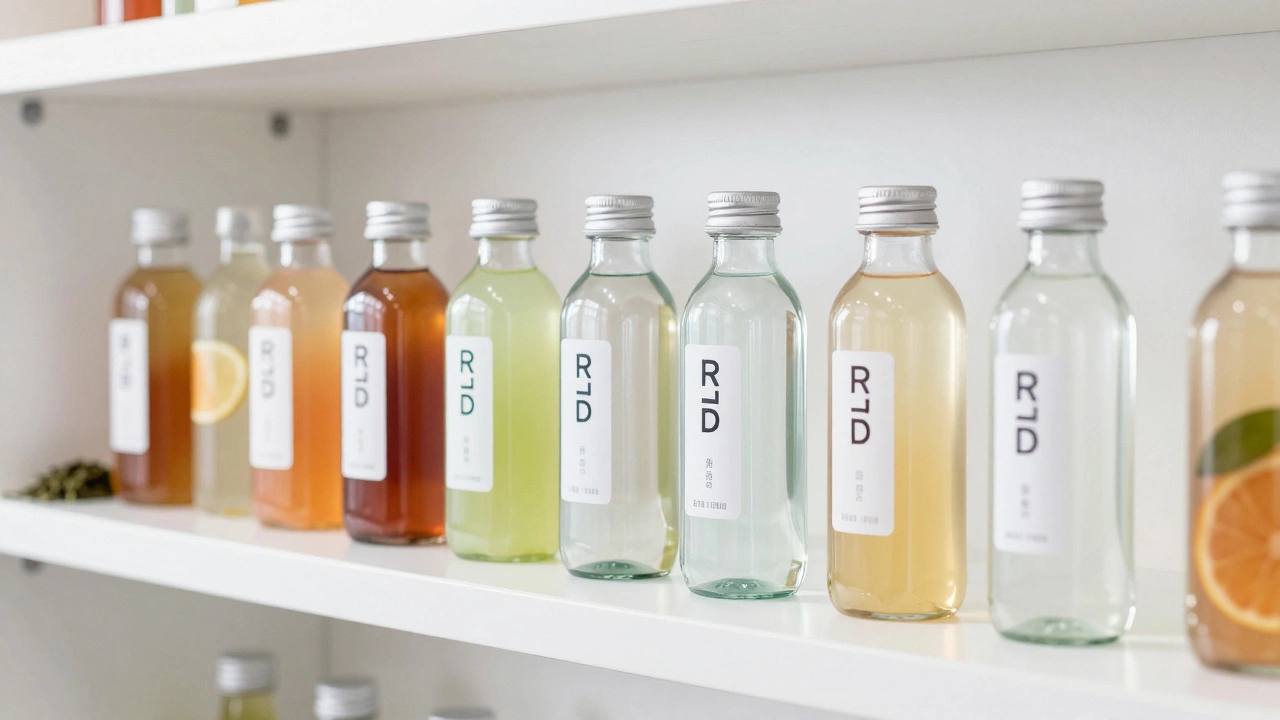
The Rise of Ready-to-Drink (RTD) Innovations
The definition of "tea" and "coffee" is expanding. Consumers, especially younger generations, are moving away from traditional brewing methods toward convenience. The global ready-to-drink tea and coffee market was valued at USD 119.84 billion in 2024. Projections suggest it will grow to USD 219.95 billion by 2034, driven by a compound annual growth rate (CAGR) of 6.3%.
Asia-Pacific holds the largest share of this RTD market, reflecting the region's tea heritage. However, Western markets are catching up. RTD tea is gaining ground because consumers view it as a healthier alternative to sugary sodas. Hybrids like the "Arnold Palmer" (iced tea mixed with lemonade) or fruit-infused teas are becoming staples in casual dining and social settings.
This trend supports tea’s overall dominance. As people cut back on high-sugar soft drinks, they aren’t switching to plain water exclusively; they’re often choosing flavored, functional, or RTD tea options. This shift helps tea maintain its lead in the tracked beverage sector despite the health-conscious move away from soda.
Health Trends Shaping Future Consumption
Looking ahead to 2026 and beyond, the non-alcoholic beverage market is shifting. The entire global beverage industry (alcoholic and non-alcoholic) hit a market size of USD 2.03 trillion in 2026. Within this, non-alcoholic beverages are growing faster than alcoholic ones, with a projected CAGR of 6.05% through 2031.
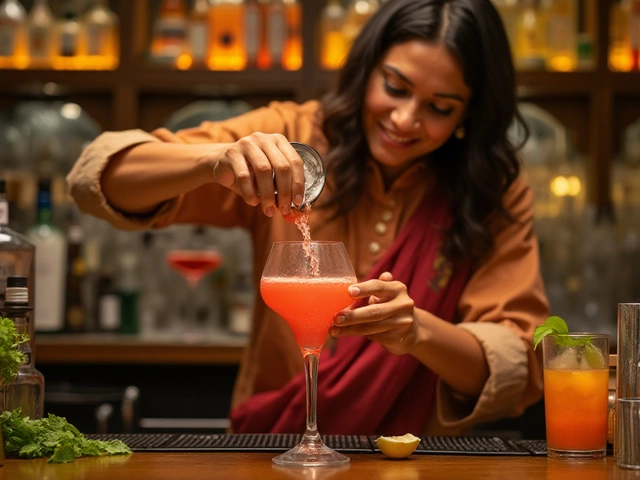
What drives this growth? Health consciousness. Consumers are actively reducing their intake of high-sugar soft drinks. Instead, they are turning to juices, sparkling waters, and functional teas. Mordor Intelligence notes that RTD tea and coffee are key drivers of this segment. This isn’t just about hydration anymore; it’s about perceived wellness benefits, such as antioxidants in green tea or probiotics in kombucha.
Kombucha, while still a niche player compared to mass-market tea, exemplifies this trend. It’s a fermented tea drink that appeals to health enthusiasts. Similarly, regional specialties like Indian chai masala, Mexican aguas frescas, and Colombian lulada are gaining international attention through platforms like TasteAtlas, which ranks these cultural beverages based on user ratings. These drinks may not have the global volume of plain tea yet, but they represent the future diversity of the non-alcoholic market.
So, Which One Is Actually #1?
To give you a straight answer, you have to pick your metric:
- By Total Human Intake: Plain water is the most popular non-alcoholic drink. It is essential for life, freely available in many regions, and constitutes over 50% of daily beverage intake in major markets like the U.S.
- By Tracked Commercial Category: Tea is the most popular non-alcoholic drink. With 4.8 billion hectoliters consumed globally in 2021, it surpasses packaged water, milk, coffee, and soft drinks in measured sales volume.
- By Brand Recognition: Carbonated soft drinks (like Cola) and major coffee chains often win in terms of marketing presence and household name value, particularly in Western countries.
For most practical purposes regarding industry analysis and retail trends, tea is the winner. For biological necessity and raw consumption volume, water takes the title. Understanding this split helps explain why you see so much tea infrastructure in Asia and so much bottled water marketing in the West.
Is water considered a non-alcoholic drink in market statistics?
Yes, water is technically a non-alcoholic beverage. However, in many commercial market reports, "packaged water" is tracked separately from other beverages like tea and coffee. Unpackaged tap water is rarely included in global sales volume data, which is why tea often appears as the #1 category in industry reports despite water being consumed in larger absolute quantities by humans.
Why is tea more popular than coffee globally?
Tea’s popularity stems from its deep cultural integration in the world’s most populous countries, specifically China and India. Additionally, tea is generally cheaper to produce and consume than coffee. The ratio of consumption is often estimated at three cups of tea for every one cup of coffee globally, driven largely by Asian markets where coffee consumption is historically lower.
Which country drinks the most coffee per capita?
The Nordic countries, particularly Finland, Norway, and Sweden, consistently rank as the highest coffee consumers per capita in the world. In these regions, coffee is the preferred core beverage, surpassing tea and soft drinks in daily preference, although global volume is still dominated by tea due to population sizes elsewhere.
Are soft drinks losing popularity to healthier alternatives?
Yes, traditional carbonated soft drinks are facing declining demand in many mature markets as consumers seek healthier options. Categories like ready-to-drink (RTD) tea, sparkling water, and juices are growing rapidly. This shift is part of a broader trend where the non-alcoholic beverage market is expanding faster than the alcoholic sector, driven by health-conscious choices.
What is the projected growth of the non-alcoholic beverage market?
As of 2026, the non-alcoholic beverage segment is projected to grow at a compound annual growth rate (CAGR) of 6.05% through 2031. This growth is outpacing the alcoholic beverage sector and is largely fueled by innovations in ready-to-drink formats, functional ingredients, and the global rise of tea and coffee convenience products.


Categories