Tea Statistics 2025: What the Numbers Say About Your Brew
If you love tea, you’ve probably wondered how many cups people actually drink and which brands dominate the market. The latest data shows a steady rise in tea consumption worldwide, and a few key trends are shaping what ends up in your mug.
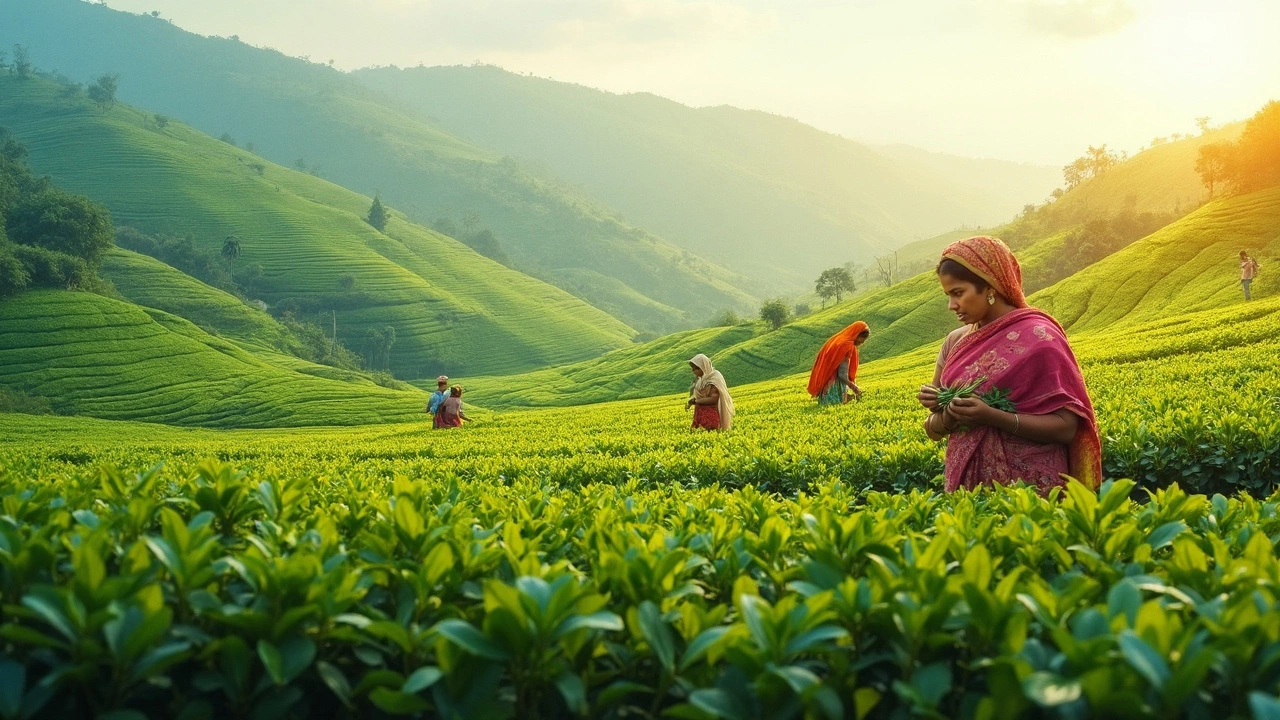
Globally, tea sales grew by 4.5% last year, pushing the market past $220 billion. Asia still leads, accounting for roughly 70% of total volume, with China alone responsible for 30% of all tea leaves produced. In the United Kingdom, per‑capita consumption nudged up to 3.2 kg per person, a small but steady jump from 2023. The United States, traditionally a coffee‑heavy market, saw tea sales rise 7%, driven by a surge in ready‑to‑drink iced teas and specialty blends.
Which Tea Types Are Winning the Charts?
Black tea remains the heavyweight champion, holding 45% of global sales. Green tea follows at 30%, thanks to its health‑focused hype and the rise of matcha drinks. Herbal and flavored teas together claim about 15% of the market, with chai and fruit‑infused blends leading the growth in the U.S. and Europe.
One surprising stat: Oolong tea sales jumped 12% in 2024, mainly because boutique tea shops marketed it as a “bridge” between black and green flavors. If you’re looking to try something new, that growth suggests plenty of quality options are now available in mainstream stores.
Top‑Tasting Brands According to Recent Blind Tests
A blind taste test conducted across the UK this year ranked three brands as the clear winners. Twinings took the top spot for its balanced black tea, while Yorkshire Tea was praised for its robust flavor that holds up with milk. For green tea lovers, Harney & Sons scored highest on freshness and smoothness.
Beyond the big names, niche brands like Ahimsa and Tea Drops are gaining market share. Ahimsa’s organic blends appeal to eco‑conscious drinkers, and Tea Drops’ dissolvable tea sticks are popular among busy professionals who want a quick, mess‑free brew.
When you buy tea, look for these cues: a bright leaf color indicates recent processing, a strong aroma points to proper storage, and a clear, even cut suggests quality grading. Brands that include detailed sourcing info on their packaging tend to score higher in consumer trust surveys.
In practical terms, the data tells you three things. First, choose a tea type that matches your health goals – green for antioxidants, black for a caffeine boost. Second, support brands that invest in sustainable farming; they are growing faster and often taste better. Third, experiment with brewing ratios – the average successful brew uses 2 grams of leaf per 200 ml of water at 85 °C for black tea and 80 °C for green tea. Adjusting time by 30 seconds can make a huge difference in flavor.
Whether you’re a casual sip‑er or a dedicated tea nerd, keeping an eye on these statistics helps you make smarter choices. The market’s expansion means more variety, better quality, and clearer information about where your cup comes from. So next time you reach for a bag, think about the numbers behind it – they’re shaping the future of tea, one steep at a time.


Categories